
7Seas: Your MetOcean data analytics solution for offshore operations
Planning and executing marine operations, particularly in the realm of offshore windfarms, demand meticulous attention to meteorological and oceanographic (metocean) conditions. This is where our latest innovation, 7Seas, comes into play.
7Seas is a comprehensive metocean data analytics platform meticulously crafted to cater specifically to the needs of planning marine operations, particularly those associated with offshore windfarm installation, operation, and maintenance. Whether you're a seasoned industry player or a newcomer navigating the waves, our 7Seas web service offers a suite of tools designed to empower your decision-making process.
Let's dive into its key features:
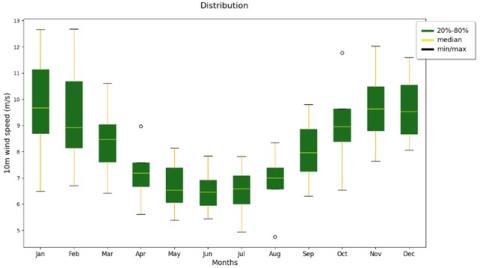
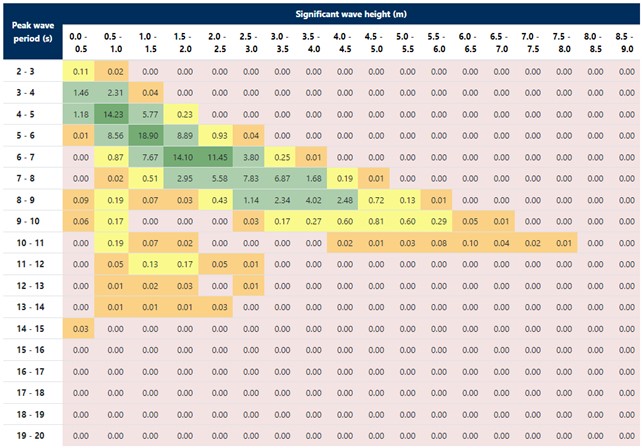
Tailored Metocean insights: 7Seas provides a tailored experience, offering a wide range of metocean data insights aligned with your project's requirements. From wind and wave rose plots to surface current tables, we've got you covered with the information you need to make informed decisions.


Comprehensive data sets: With access to monthly means, percentiles, and weather window calculations for various meteorological and oceanographic parameters such as wind speed, significant wave height, swell height, surface current, temperature, precipitation, and humidity, 7Seas equips you with the comprehensive data sets necessary for thorough planning.

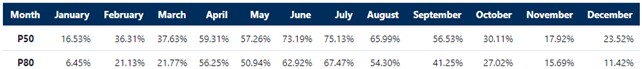
The P50 value is the medium probability of a weather window. The probability of a weather window varies year-to-year in the data set and the P80-value represents a year with worse weather conditions than the median value, where 80% of years will have a higher likelihood for weather windows for the specific month. The data in this example is valid for a position in the central part of the North Sea.
Validation, quality assurance and ramp up/ramp down analysis
We understand the importance of data validation and quality assurance. That's why 7Seas allows customers to incorporate their measurement data, facilitating a validation process to ensure the accuracy and reliability of the hindcast data and analytics.
The 7Seas platform also conducts a thorough ramp up/ramp down analysis (the timing of increasing/decreasing winds and rising/falling wave height), validating calculated weather windows and providing insights into how well the hindcast model will perform during project execution. This feature requires local measurement data from the customer.
While the standard setup utilizes global ERA5 hindcast data and HYCOM surface current reanalysis data, 7Seas offers flexibility. Customers can opt for higher resolution regional or local model setups tailored to their specific needs.
Why choose the 7Seas web service?
Choosing 7Seas isn't just about accessing metocean data; it's about gaining a competitive edge in the dynamic world of offshore operations. With our tailored insights, comprehensive data sets, and commitment to validation and quality assurance, 7Seas empowers you to make informed decisions, mitigate risks, and optimize project outcomes.
Whether you're planning the installation of a sea cable or optimizing maintenance operations, this platform is your trusted companion every step of the way.
Stay ahead of the curve with 7Seas – your reliable and easy to use data analytics solution for offshore success. Get in touch with us at sales@ventomaritime.dk to learn more about how our web service can transform your marine operations. You can even have a free 14-day trial to check it out.